Heating, Air Conditioning, and Refrigeration Mechanic and Installer Salary in California: $70,902 (2026)
Quick Answer:Across California's 158 metropolitan areas, the average median heating, air conditioning, and refrigeration mechanic and installer pay sits at $70,902/year heading into 2026 — a figure projected from 2025 BLS OEWS wage data for SOC 49-9021. Because California sits at BEA RPP 113.1 (13% above the U.S. baseline), that statewide median translates to roughly $62,690 in nationally-comparable purchasing power. Highest-paying metros: Napa ($80,342), Sunnyvale ($79,778), Santa Clara ($79,254).
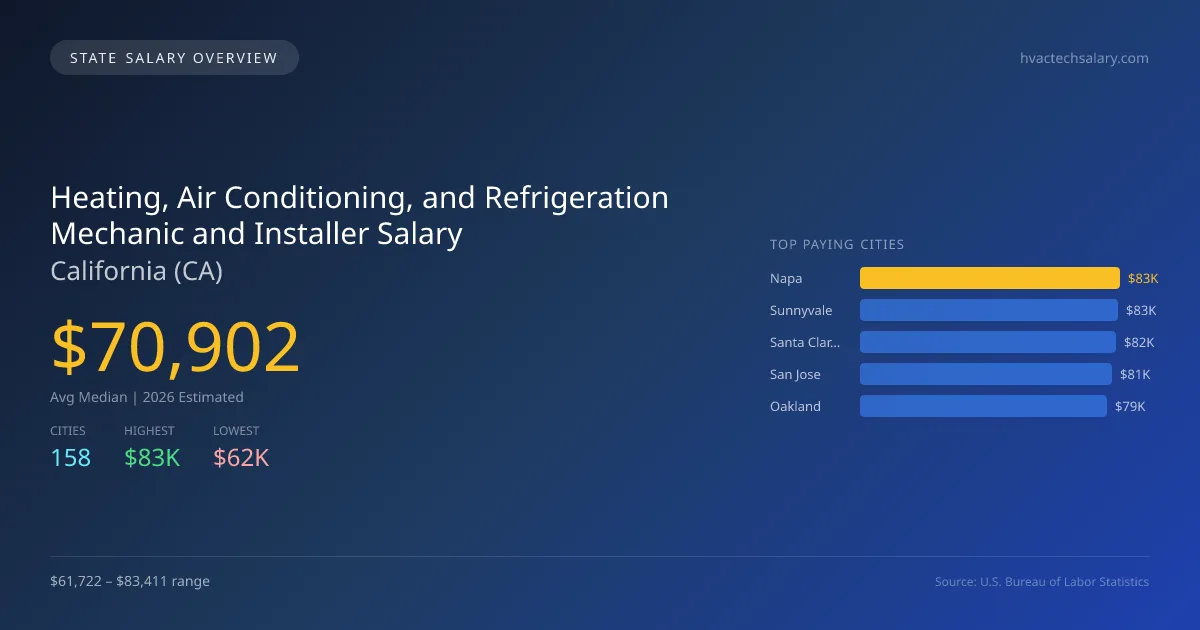
The salary landscape for heating, air conditioning, and refrigeration mechanics and installers in California is notably higher than the national average. In 2026, the average median salary in California is projected to be $70,902, which is 17.8% above the national median of $60,174. This figure reflects the strong demand for skilled tradespeople in the state, driven by its diverse climate and the growing emphasis on energy efficiency. There is a significant salary range within California, where the highest paying city, Napa, offers an average of $83,411, while Fresno, the lowest paying city, has an average of $61,722, a difference of $21,689. Factors influencing this disparity include local cost of living, competition among employers, and specific regional demand for HVAC services. California also has distinct state licensing requirements and scope of practice laws that can affect earnings and employment opportunities. The job market shows a positive outlook, with a projected growth rate of 3.82% annually. With a total employment figure of 37,189 in this sector, prospects remain strong for individuals pursuing careers in heating, air conditioning, and refrigeration mechanics and installers across the state.
California Heating, Air Conditioning, and Refrigeration Mechanic and Installer Salary Range
Overall salary range in California: $37,620 (lowest entry-level) to $134,777 (highest top earner)
California vs National Average
California heating, air conditioning, and refrigeration mechanics and installers earn 17.83% more than the national median (+$10,728/year difference).
California Heating, Air Conditioning, and Refrigeration Mechanic and Installer Salary Distribution (2026)
Heating, Air Conditioning, and Refrigeration Mechanic and Installer salaries in California range from $46,685 (entry-level, 10th percentile) to $108,138 (top earners, 90th percentile), with a median of $70,902. The California median is $10,728 above the US national median of $60,174. The average hourly rate is $34.09/hr. Approximately 37,189 heating, air conditioning, and refrigeration mechanic and installers are employed across 158 cities.
2019 BLS Actual
$57,332
2025 BLS Actual
$68,293
2026 Current Est.
$70,902
2019–2027 Growth
+28.4%
Salary Trajectory for Heating, Air Conditioning, and Refrigeration Mechanics and Installers in California (2019–2027)
2019–2025: actual BLS OEWS data for this metro area. 2026+: CAGR 3.82% projection.
| Year | Annual Salary | Status |
|---|---|---|
| 2019 | $57,332 | Actual |
| 2020 | $60,324 | Actual |
| 2021 | $58,744 | Actual |
| 2022 | $62,106 | Actual |
| 2023 | $64,204 | Actual |
| 2024 | $68,330 | Actual |
| 2025 | $68,293 | Actual |
| 2026(current) | $70,902 | Estimated |
| 2027 | $73,610 | Projected |
Based on 7 years of BLS OEWS data for the California metropolitan area, the median heating, air conditioning, and refrigeration mechanic and installer salary grew 19.1% from $57,332 (2019) to $68,293 (2025). At a 3.82% compound annual growth rate, salaries are projected to reach $73,610 by 2027 — a total increase of $16,278 (28.39%) from 2019.
Note: Historical values (2019–2025) are actual BLS OEWS figures for the California metropolitan area, sourced from annual Occupational Employment and Wage Statistics surveys. 2026–2026 figures are current estimates, and 2027 values are projections, calculated using a 3.82% CAGR derived from 7-year BLS historical data. Actual salaries may vary based on employer, experience, certifications, and local market conditions.
Top 5 Highest Paying Cities in California
Lowest Paying Cities in California
Best Value Cities for Heating, Air Conditioning, and Refrigeration Mechanics and Installers in California
When adjusted for local cost of living, these California cities offer the most purchasing power for heating, air conditioning, and refrigeration mechanics and installers.
| City | Nominal Salary | CoL Index | Adjusted Salary |
|---|---|---|---|
| El Centro | $74,189 | 95.174 | $77,951 |
| Napa | $83,411 | 112.554 | $74,108 |
| San Jose | $80,926 | 110.423 | $73,287 |
| Sunnyvale | $82,826 | 113.1 | $73,233 |
| Santa Rosa | $78,420 | 107.784 | $72,757 |
Adjusted salary = nominal salary × (100 / CoL index). CoL index: 100 = national average. Lower index = lower cost of living.
Salary by Experience Level in California
| Experience Level | Estimated Annual |
|---|---|
| Entry Level (0-2 years) | $46,685 |
| Mid Career (3-7 years) | $70,902 |
| Experienced (7+ years) | $108,138 |
Estimates based on BLS percentile data averaged across California metro areas. Individual pay varies by employer, certifications, and specialization.
All 158 Cities in California
| # | City | Median Salary |
|---|---|---|
| 1 | Napa | $83,411 |
| 2 | Sunnyvale | $82,826 |
| 3 | Santa Clara | $82,282 |
| 4 | San Jose | $80,926 |
| 5 | Oakland | $79,176 |
| 6 | Santa Rosa | $78,420 |
| 7 | Petaluma | $77,671 |
| 8 | Santa Maria | $77,562 |
| 9 | Fremont | $77,430 |
| 10 | San Francisco | $77,414 |
| 11 | Santa Cruz | $77,257 |
| 12 | Stockton | $74,673 |
| 13 | El Centro | $74,189 |
| 14 | San Luis Obispo | $74,130 |
| 15 | Anaheim | $74,114 |
| 16 | Chula Vista | $73,940 |
| 17 | San Diego | $73,853 |
| 18 | Lodi | $73,642 |
| 19 | Carlsbad | $73,236 |
| 20 | Long Beach | $73,060 |
| 21 | Santa Ana | $72,848 |
| 22 | Los Angeles | $72,818 |
| 23 | Salinas | $71,556 |
| 24 | Fontana | $71,500 |
| 25 | Irvine | $71,422 |
| 26 | Pomona | $71,073 |
| 27 | Simi Valley | $71,034 |
| 28 | Escondido | $71,017 |
| 29 | Fairfield | $70,889 |
| 30 | Fullerton | $70,629 |
| 31 | Daly City | $70,567 |
| 32 | El Monte | $70,545 |
| 33 | Vista | $70,506 |
| 34 | Concord | $70,490 |
| 35 | Clovis | $70,384 |
| 36 | Garden Grove | $70,312 |
| 37 | Temecula | $70,295 |
| 38 | Santa Clarita | $70,248 |
| 39 | Lancaster | $70,156 |
| 40 | Inglewood | $70,156 |
| 41 | Corona | $70,067 |
| 42 | Richmond | $70,057 |
| 43 | Rialto | $70,022 |
| 44 | Torrance | $69,934 |
| 45 | Elk Grove | $69,800 |
| 46 | Oceanside | $69,784 |
| 47 | Whittier | $69,764 |
| 48 | San Rafael | $69,758 |
| 49 | Rancho Cucamonga | $69,695 |
| 50 | Hayward | $69,656 |
| 51 | Woodland | $69,638 |
| 52 | Buena Park | $69,627 |
| 53 | Encinitas | $69,622 |
| 54 | Downey | $69,618 |
| 55 | Dublin | $69,578 |
| 56 | Redlands | $69,556 |
| 57 | Chino | $69,519 |
| 58 | Westminster | $69,497 |
| 59 | Santa Monica | $69,491 |
| 60 | San Mateo | $69,484 |
| 61 | Tulare | $69,464 |
| 62 | San Buenaventura | $69,440 |
| 63 | Mission Viejo | $69,393 |
| 64 | Moreno Valley | $69,392 |
| 65 | Pleasanton | $69,382 |
| 66 | Pasadena | $69,284 |
| 67 | Santee | $69,235 |
| 68 | Glendale | $69,173 |
| 69 | Mountain View | $69,137 |
| 70 | Pittsburg | $69,132 |
| 71 | Novato | $69,110 |
| 72 | Costa Mesa | $69,084 |
| 73 | Berkeley | $69,012 |
| 74 | Huntington Beach | $68,995 |
| 75 | Jurupa Valley | $68,934 |
| 76 | Hemet | $68,914 |
| 77 | Union City | $68,908 |
| 78 | West Covina | $68,901 |
| 79 | Chino Hills | $68,881 |
| 80 | Gilroy | $68,783 |
| 81 | Oxnard | $68,755 |
| 82 | San Marcos | $68,745 |
| 83 | Tustin | $68,685 |
| 84 | San Ramon | $68,680 |
| 85 | Eastvale | $68,615 |
| 86 | Murrieta | $68,612 |
| 87 | Vacaville | $68,612 |
| 88 | Brentwood | $68,581 |
| 89 | Hesperia | $68,549 |
| 90 | Lake Elsinore | $68,544 |
| 91 | Thousand Oaks | $68,477 |
| 92 | Citrus Heights | $68,457 |
| 93 | El Cajon | $68,396 |
| 94 | San Clemente | $68,375 |
| 95 | Bellflower | $68,348 |
| 96 | Palmdale | $68,318 |
| 97 | La Mirada | $68,317 |
| 98 | Apple Valley | $68,304 |
| 99 | Menifee | $68,284 |
| 100 | Yucaipa | $68,255 |
| 101 | Norwalk | $68,250 |
| 102 | Rancho Cordova | $68,190 |
| 103 | Montebello | $68,125 |
| 104 | Compton | $68,098 |
| 105 | Porterville | $68,048 |
| 106 | Lompoc | $68,039 |
| 107 | Hawthorne | $67,934 |
| 108 | Antioch | $67,912 |
| 109 | Burbank | $67,907 |
| 110 | Alhambra | $67,749 |
| 111 | Livermore | $67,749 |
| 112 | Orange | $67,728 |
| 113 | South Gate | $67,727 |
| 114 | Victorville | $67,711 |
| 115 | West Sacramento | $67,689 |
| 116 | Poway | $67,671 |
| 117 | San Leandro | $67,580 |
| 118 | Indio | $67,504 |
| 119 | Lake Forest | $67,504 |
| 120 | Carson | $67,383 |
| 121 | Rocklin | $67,373 |
| 122 | Newport Beach | $67,259 |
| 123 | Redwood City | $67,254 |
| 124 | Turlock | $67,237 |
| 125 | Manteca | $67,215 |
| 126 | Perris | $67,210 |
| 127 | Madera | $67,155 |
| 128 | Baldwin Park | $67,036 |
| 129 | Palo Alto | $67,036 |
| 130 | Vallejo | $67,019 |
| 131 | Lakewood | $67,009 |
| 132 | Beaumont | $66,812 |
| 133 | Tracy | $66,796 |
| 134 | Alameda | $66,774 |
| 135 | Laguna Niguel | $66,757 |
| 136 | Milpitas | $66,725 |
| 137 | Camarillo | $66,583 |
| 138 | Oakley | $66,556 |
| 139 | Davis | $66,540 |
| 140 | Upland | $66,490 |
| 141 | La Habra | $66,393 |
| 142 | Lynwood | $66,366 |
| 143 | Folsom | $66,201 |
| 144 | Sacramento | $65,756 |
| 145 | Bakersfield | $65,490 |
| 146 | Roseville | $65,486 |
| 147 | Brea | $65,233 |
| 148 | Ontario | $64,273 |
| 149 | Visalia | $64,100 |
| 150 | Modesto | $63,872 |
| 151 | San Bernardino | $63,497 |
| 152 | Riverside | $63,418 |
| 153 | Merced | $63,162 |
| 154 | Redding | $62,156 |
| 155 | Chico | $62,057 |
| 156 | Yuba City | $61,989 |
| 157 | Hanford | $61,811 |
| 158 | Fresno | $61,722 |
More California Salary Data
Hourly Rates
Explore heating, air conditioning, and refrigeration mechanic and installer hourly pay in California cities.
Entry Level
Starting salaries for new heating, air conditioning, and refrigeration mechanics and installers.
Senior / Experienced
Top earner salaries for experienced heating, air conditioning, and refrigeration mechanics and installers.
Compare Cities in California
View all comparisons →Explore More Heating, Air Conditioning, and Refrigeration Mechanic and Installer Salary Data
Frequently Asked Questions
How much do heating, air conditioning, and refrigeration mechanics and installers make in California in 2026?
What is the highest paying city for heating, air conditioning, and refrigeration mechanics and installers in California?
How does California heating, air conditioning, and refrigeration mechanic and installer pay compare to the national average?
What is the entry-level heating, air conditioning, and refrigeration mechanic and installer salary in California?
How many heating, air conditioning, and refrigeration mechanics and installers are employed in California?
Which California city offers the best value for heating, air conditioning, and refrigeration mechanics and installers?
Written by Jordan Lee, HVAC Technician
Career Analyst
Jordan has 10 years of experience in HVAC systems. He specializes in residential installation and maintenance.
Methodology & Data Source
Statewide salary figures on this page are 2026 projections based on the Bureau of Labor Statistics Occupational Employment and Wage Statistics (OEWS) survey, May 2026 release. A 3.82% compound annual growth rate (CAGR), derived from 6-year national BLS wage trends, was applied to each metro area's reported salary to estimate current 2026 heating, air conditioning, and refrigeration mechanic and installer compensation across California. State averages are employment-weighted across 158 metro areas — larger metro areas with more heating, air conditioning, and refrigeration mechanics and installerscontribute proportionally more to the average, producing figures that better reflect typical compensation. Individual pay varies by city, employer, certifications, and experience.
Data Sources & Methodology
Source: BLS, OEWS, 7-year dataset (–). Per-city data from annual BLS metropolitan area surveys.
2026 figures are projected from 2025 BLS data using a compound annual growth rate (CAGR) of 3.82%, derived from historical BLS wage trends for heating, air conditioning, and refrigeration mechanic and installers (SOC 49-9021).
Compiled and verified by Jordan Lee, HVAC Technician, a licensed heating, air conditioning, and refrigeration mechanic and installer with 10+ years of clinical experience. · View source data at BLS.gov